
Track Real-World Loading Time with .htaccess
Website speed is essential for user experience, SEO ranking, and overall business performance. However, many website owners use tools like Pingdom or GTmetrix to measure loading times. They are unaware that these tools provide theoretical results from data center servers and not real-world conditions experienced by end-users. This inconsistency often leads to a suspicion that their websites are slower than reported. To address this concern, server-side tracking using .htaccess provides a method to measure real-world loading times directly from your server. This is done by capturing the exact time users experience when visiting your site. This article will guide you through setting up server-side tracking, analyzing logs, and interpreting the data to make sure that your website runs efficiently for real users, not just in theory.
Why do Theoretical Measurements Fall Short
While tools like Pingdom and GTmetrix provide valuable information about website speed, they have limitations. They simulate loading times from specific data centers that are often optimized for speed and connectivity. In contrast, real users access your website from various locations, with different network conditions and devices. This difference creates a gap between theoretical measurements and actual user experience.
The Consequence of Slow Websites
Slow websites can result in serious consequences, like lower user engagement, higher bounce rates, decreased search engine rankings, and finally lower revenue. Conducting practical testing is important to prevent these problems and properly evaluate the performance of your website.
How to Measure Real-World Loading Times
The steps below will give you an understanding of how to measure and analyze real-world loading times.
Step 1: Data Gathering Configuration with .htaccess
To measure real-world loading times, we start by configuring your web server to log the required data. By making use of .htaccess, we can collect accurate data on every request and the duration it takes to complete. Follow the instructions provided to set it up.
Enable the Rewrite Engine
Start by enabling the rewrite engine in your .htaccess file.
RewriteEngine On
Define a Custom Log Format
Next, define a custom log format to capture all necessary details about each request. This is achieved by adding the following lines to your .htaccess file.
LogFormat "%h %l %u %t \"%r\" %>s %b \"%{Referer}i\" \"%{User-Agent}i\" %D" timed_combined
CustomLog /var/log/apache2/timed_access.log timed_combined
The definition of each character in the above code is mentioned below.
- %h logs the remote hostname.
- %l logs the remote log name.
- %u logs the remote user.
- %t logs the time the request was received.
- %r logs the first line of the request.
- %>s logs the status code.
- %b logs the size of the response in bytes.
- %{Referer}i logs the Referer header.
- %{User-Agent}i logs the User-Agent header.
- %D logs the time taken to serve the request, in microseconds.
This configuration creates a detailed log file, timed_access.log. It captures the loading time data for every request received by the server.
Step 2: Analyze the Logs
After gathering the data, it is important to periodically examine the logs to gain information on the loading times of your website. This can be done using a script. Here is a sample of how Python can be used to analyze the log file and determine the average loading times.
Example Python Script to Analyze Logs:
The following Python script reads the timed_access.log file, extracts the relevant data, and calculates the average loading time:
import re
# Define the log file location
log_file = '/var/log/apache2/timed_access.log'

# Regular expression pattern to extract the time taken in microseconds
pattern = r'(\d+)$'

# Initialize variables to store total time and number of requests
total_time = 0
request_count = 0

# Open the log file and process each line
with open(log_file, 'r') as file:
    for line in file:
        match = re.search(pattern, line)
        if match:
            # Convert the extracted time to an integer and add to total time
            total_time += int(match.group(1))
            request_count += 1

# Calculate the average loading time
if request_count > 0:
    average_time = total_time / request_count
    print(f'Average loading time: {average_time / 1000:.2f} milliseconds')
else:
    print('No valid data found in log file.')
This script uses a regular expression to find and extract the loading time for each request from the log file. It then computes the average loading time in milliseconds. The value obtained provides a clear picture of how long users wait for your website to load.
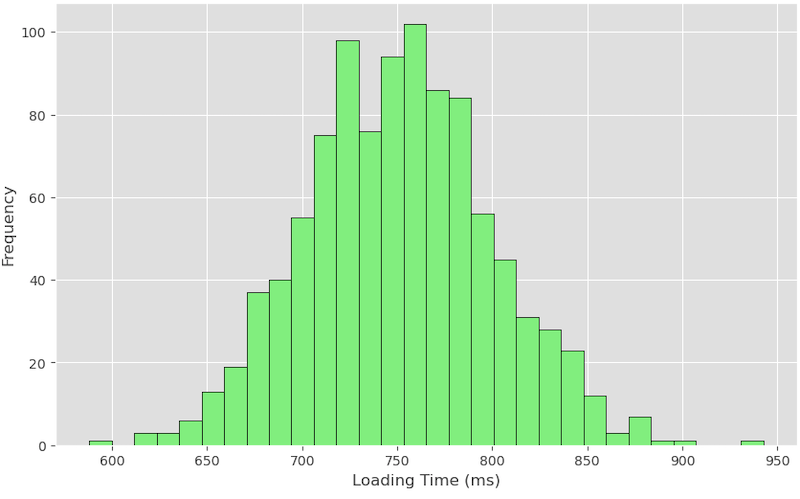
You can also create scripts to visualise the data which should give you a spread converging toward your actual loading time.
Step 3: Data Interpretation
With the analyzed data, you can now interpret the loading times to assess your website’s performance accurately. Here are some key factors to consider.
- Identify Slow Requests: Look for requests that take significantly longer than the average loading time. These could indicate performance bottlenecks or issues such as large images, unoptimized code, or slow server response times.
- Geographical Analysis: If your log format includes the client’s IP address or hostname, you can identify where slow loading times are more common. This may help in understanding if certain regions experience more latency. Such information can point out the need to implement solutions like a content delivery network.
- User Behavior Patterns: By examining the Referer and User-Agent headers, you can gather information about user behavior, like the types of devices and browsers utilized by your site’s visitors. This information helps optimize the website for the most common user configurations.
- Benchmarking: Regularly monitoring and comparing loading times allows you to benchmark your website’s performance over time. You can track the impact of changes, such as code optimizations or hosting improvements, on real-world loading times.
Why Real-World Testing Matters
By measuring real-world loading times, you move beyond theoretical assumptions to understand the experience of your users. This understanding allows you to make specific improvements that improve performance where it counts, on the devices and networks your customers are using. Theoretical tools like GTmetrix or Pingdom provide valuable data but are not enough on their own. Combining them with real-world measurements guarantees that you are not just optimizing for test environments but for real people.
Solutions
It’s important to put solutions in place that improve performance across a range of criteria to properly handle real-world loading time issues. These are some effective solutions.
- Edge Hosting Solutions: A Content Delivery Network helps improve loading times by caching content at servers closer to your users. This reduces latency and speeds up delivery, especially for users geographically distant from your primary server. Using CDN solutions like Cloudflare or AWS CloudFront can significantly improve real-world performance.
- DNS Anycast: DNS Anycast is another effective strategy. It distributes DNS queries to the nearest available server, which can reduce resolution time and contribute to faster loading times. By combining server-side tracking with CDN and DNS Anycast, you can make sure that your website remains responsive, no matter where your users are located.
- Shared Hosting Optimizations: Make sure your shared hosting environment is optimized for performance. This includes using server-side caching, optimizing your server’s configuration, and allocating sufficient resources for high-traffic periods.
Conclusion
To truly understand your website’s performance, it is necessary to measure real-world loading times using server-side tracking with .htaccess. This approach provides accurate data that reflects the actual user experience, unlike theoretical tools that can often mislead. By collecting, evaluating, and understanding this data, you can make the right decisions to increase your website’s effectiveness. This guarantees quick and reliable access for every user. Implementing solutions such as CDN, and DNS Anycast, and optimizing shared hosting environments will increase these benefits. This will deliver a smooth experience foryour audience.


